目标
Linux应用程序的稳定性是个一直让人头疼的问题,尤其是代码崩溃、内存泄漏、内存一直增大、CPU性能、线程问题之类的全局性问题,出问题的时候经常是毫无线索,无从下手。如果没有强大的工具,一般只能通过打印日志+注释代码+读代码的方式,来大海捞针式的找问题。
作者经过一段时间的探索,整理了一套用于定位以上问题的工具链,可以大大加速以上问题的定位,而定位到问题就相当于解决了90%。
| 问题 | 目标 | 工具 | 对性能的影响 | 生产环境能否启动 |
|---|---|---|---|---|
| 代码崩溃 | 在出现代码崩溃时,捕捉出问题代码的调用栈,精确到代码行 | 自己实现(backtrace相关函数) | 1x | 能 |
| 内存误用 | 定位访问未初始化内存、数组下标越界、int值溢出、未定义行为、堆/栈buffer溢出等问题 | AddressSanitizer(支持g++)/MemorySanitizer(仅支持clang++) | 2x | 否 |
| 内存泄漏 | 监控应用程序运行时的内存泄漏情况,以调用栈形式展示,精确到代码行,包含内存泄漏量 | LeakSanitizer | 2x | 否 |
| 内存占用量 | 非内存泄漏,但出现内存占用量不断增大的问题,定位到内存增加的位置 | gperftools | 1-20x | 否 |
| CPU性能瓶颈 | 在出现CPU性能问题时,快速定位到CPU资源消耗最多的位置 | gperftools/gprof | gprof未测试 | 否 |
| 线程问题 | 快速定位线程死锁、Data race等问题的原因 | ThreadSanitizer | 未测试 | 否 |
代码崩溃
该问题通过(1)在应用程序中接收信号,(2)调用C运行库中的backtrace找到调用栈,(3)调用Linux的addr2line工具,实现崩溃时打开代码行功能。
实现方法
一、编译系统中,添加”-g -rdynamic”编译选项。”-rdynamic”用于存储动态符号表,保证可根据地址找到函数名;”-g”用于生成调试信息,保证通过地址找到代码行数。
二、代码实现:
-
头文件中添加以下内容:
#include <signal.h> /* for signal */* #include <execinfo.h> /* for backtrace() */ -
添加监控信号量,应用程序:
signal(SIGABRT, signal_function); signal(SIGFPE, signal_function); signal(SIGSEGV, signal_function); signal(SIGINT, signal_function); -
在 signal_function 函数中,通过backtrace()和backtrace_symbol()函数获取到函数名和地址;
-
通过systerm函数调用addr2line工具,获取地址对应的代码行。(具体代码略)
最后结果:
./a.out
The pid is:115619
The .so name is:./libmyhello.so
The Base address of the ./libmyhello.so is:7f0f3e2b6000
The Stack Address is:0x7f0f3e2b66bb
OffsetAddress:1723
/mnt/hgfs/WorkSpace/catch_crash/hello.c:5
注意
动态库在内存中会被分配一个基地址,在该地址的基础上做偏移,处理时需要考虑该基地址。
内存泄漏
该问题可以通过Google开发的LeakSanitizer工具实现,该工具已集成到GNU中,用起来非常方便。
实现方法
一、编译系统中,添加”-g -rdynamic -fsanitize=leak -fomit-frame-pointer”编译选项。”-rdynamic”用于存储动态符号表,保证可根据地址找到函数名;”-g”用于生成调试信息,保证通过地址找到代码行数。
二、运行程序,在程序退出时,会自动打印类似以下内容:
==4088==ERROR: LeakSanitizer: detected memory leaks

Direct leak of 7 byte(s) in 1 object(s) allocated from:
    #0 0x7ff9ae510602 in malloc (/usr/lib/x86_64-linux-gnu/libasan.so.2+0x98602)
    #1 0x4008d3 in main /home/ron/dev/as/mem_leak.cpp:8
    #2 0x7ff9ae0c882f in __libc_start_main (/lib/x86_64-linux-gnu/libc.so.6+0x2082f)

SUMMARY: AddressSanitizer: 7 byte(s) leaked in 1 allocation(s).
说明
Direct Leak和Indirect Leak的区别:
directly leaked blocks: not reachable from anywhere
indirectly leaked blocks: reachable from other leaked blocks
内存占用量
该问题通过gperftools实现监控。使用起来略麻烦。
实现方法
一、安装依赖环境
sudo apt install autoconf automake libtool
sudo apt install libunwind8-dev
sudo apt install graphviz // 用于生成web页面、pdf等图像
二、下载gperftools源代码并编译
git clone https://github.com/gperftools/gperftools
cd gperftools/
./autogen.sh
./configure
make
sudo make install
vim /etc/ld.so.conf // 添加以下内容:/usr/local/lib
sudo ldconfig
三、2种方法调用HeapProfiler工具
(1)在代码中添加以下内容
#include <gperftools/profiler.h>
HeapProfilerStart("heap.prof"); // 程序开始时调用
HeapProfilerStop(); // 程序结束时调用
(2)在运行时添加环境变量(无需修改代码)
# env HEAPPROFILE=/heap/save/file/path /your/application/path
四、添加编译链接选项
# g++ ./tmp_test.cpp -o tmp_test -g -ltcmalloc -lprofiler // 注意:-ltcmalloc -lprofiler这2个选项必须添加在.cpp/.c文件后面,否则会报错
五、将编译gperftools时生成的libtcmalloc.so.4.5.9和libprofiler.so.0.5.4文件,拷贝到应用程序目录中,并添加软件链接:
# ln -s libprofiler.so.0.5.4 libprofiler.so.0
# ln -s libtcmalloc.so.4.5.9 libtcmalloc.so.4
五、运行程序.程序运行过程中会按规则每隔一定时间保存一张内存使用快照到文件夹中
heap.prof.0001.heap
heap.prof.0002.heap
heap.prof.0003.heap
heap.prof.0004.heap
heap.prof.0005.heap
...
六、分析其中某一张快照,生成可人工查看的PDF
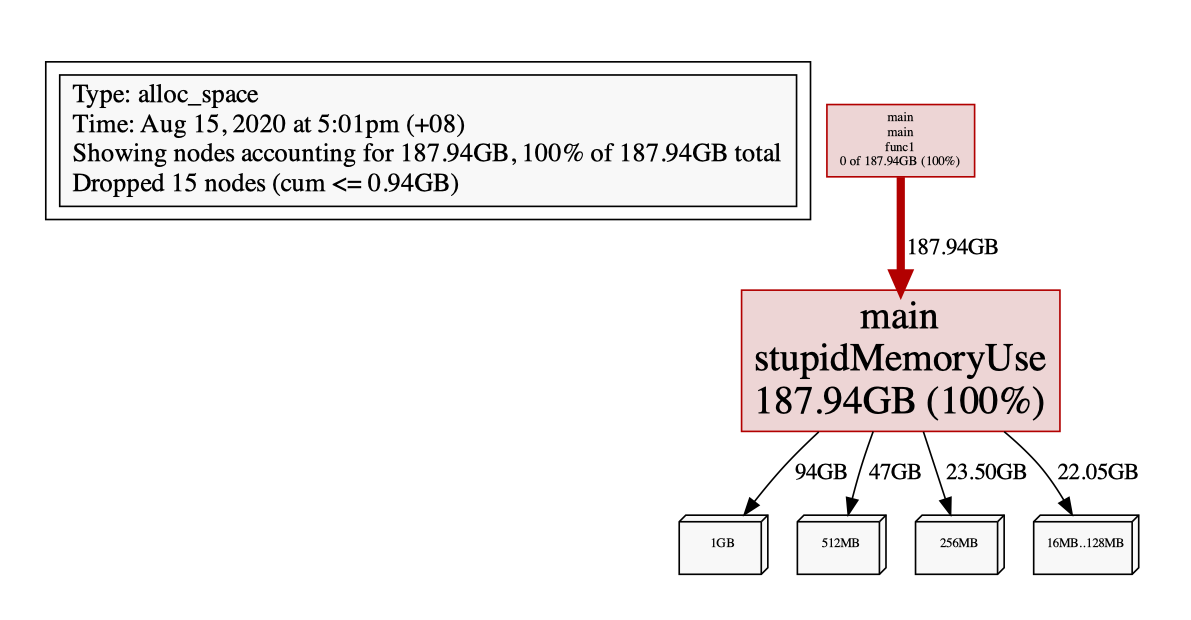
# pprof --lib_prefix=your/so/lib/dir/path/ --inuse_space --lines your/application/path ./heap.prof.1000.heap --pdf > inuse_1000.pdf
示例结果如下:
七、将2个时间点的快照做对比,即用快照2减快照1,得到这段时间内内存的变化量
# pprof --lib_prefix=your/so/lib/dir/path/ --inuse_space --lines your/application/path --base ./heap.prof.0100.heap ./heap.prof.1000.heap --pdf > inuse_100to1000.pdf
保存内存快照的规则
通过运行程序时的环境变量实现。常用规则如下:
| 环境变量 | 说明 | 默认值 |
|---|---|---|
| HEAP_PROFILE_ALLOCATION_INTERVAL | Dump heap profiling information each time the specified number of bytes has been allocated by the program | 1073741824 (1 Gb) |
| HEAP_PROFILE_INUSE_INTERVAL | Dump heap profiling information whenever the high-water memory usage mark increases by the specified number of bytes. | 104857600 (100 Mb) |
| HEAP_PROFILE_TIME_INTERVAL | 每隔几秒钟保存一张快照 | 0 |
示例:
# env HEAP_PROFILE_TIME_INTERVAL=60 /your/application/path
pprof命令选项
| 选项 | 说明 |
|---|---|
| –lib_prefix | 程序运行时依赖的库文件目录 |
| –lines/–func | 精确到代码行/函数 |
| –base | 当前快照与哪一个基础快照做对比(相减) |
| –pdf/–gif | 输出格式 |
| –inuse_space | (用于定位内存增长问题)Display the number of in-use megabytes (i.e. space that has been allocated but not freed). This is the default. |
| –inuse_objects | Display the number of in-use objects (i.e. number of objects that have been allocated but not freed). |
| –alloc_space | (用于定位内存申请过于频繁问题)Display the number of allocated megabytes. This includes the space that has since been de-allocated. Use this if you want to find the main allocation sites in the program. |
| –alloc_objects | Display the number of allocated objects. This includes the objects that have since been de-allocated. Use this if you want to find the main allocation sites in the program. |
CPU性能瓶颈
使用gperftools工具,参考<内存占用量>项。
在代码中调用的函数是
#include <gperftools/profiler.h>
ProfilerStart("heap.prof"); // 程序开始时调用
ProfilerStop(); // 程序结束时调用
后续数据分析用pprof工具。
内存误用
使用AddressSanitizer/MemorySanitizer工具,参考<内存泄漏>项。
编译时添加-g -fsanitize=address -fno-omit-frame-pointer选项:
g++ ./tmp_test.cpp -o tmp_test -g -fsanitize=address -fno-omit-frame-pointer
然后直接运行。运行结束后会打印内存误用、内存泄漏相关信息。
线程问题
使用ThreadSanitizer工具,参考<内存泄漏>项。
参考文档
Linux下进程崩溃时定位源代码位置:https://developer.aliyun.com/article/33083